


Items
Conforms To is exactly
ACRL: Information Creation as a Process;
-
 How to Annotate an Image in Google Slides Advice from a librarian on making an annotated image using Google Slides. We'll be using a crafting diagram as our example.
 -
 How to Annotate an Image or Figure in PowerPoint Advise from a librarian on making an annotated image in PowerPoint. We'll be using a crafting pattern image for our example. Here's the link to the pattern we use at the example - https://friendship-bracelets.net/patterns/3643
 -
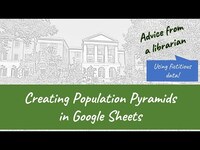 How to Make Population Pyramids in Google Sheets Advice from a librarian on making a population pyramid, by modifying a stacked bar chart. Our data will be fictitious info on a Sunday School Program's 'population'. For more on population pyramids, we recommend the Data Visualisation Catalogue's page - https://datavizcatalogue.com/index.html
 -
 How to Make Population Pyramids in Microsoft Excel Advise from a librarian on making a population pyramid in Excel, even though there is no preset template for it. We'll be using fictitious data for a Sunday School program for our example. For more about population pyramids we recommend the Data Visualisation Catalogue page: https://datavizcatalogue.com/methods/population_pyramid.html
 -
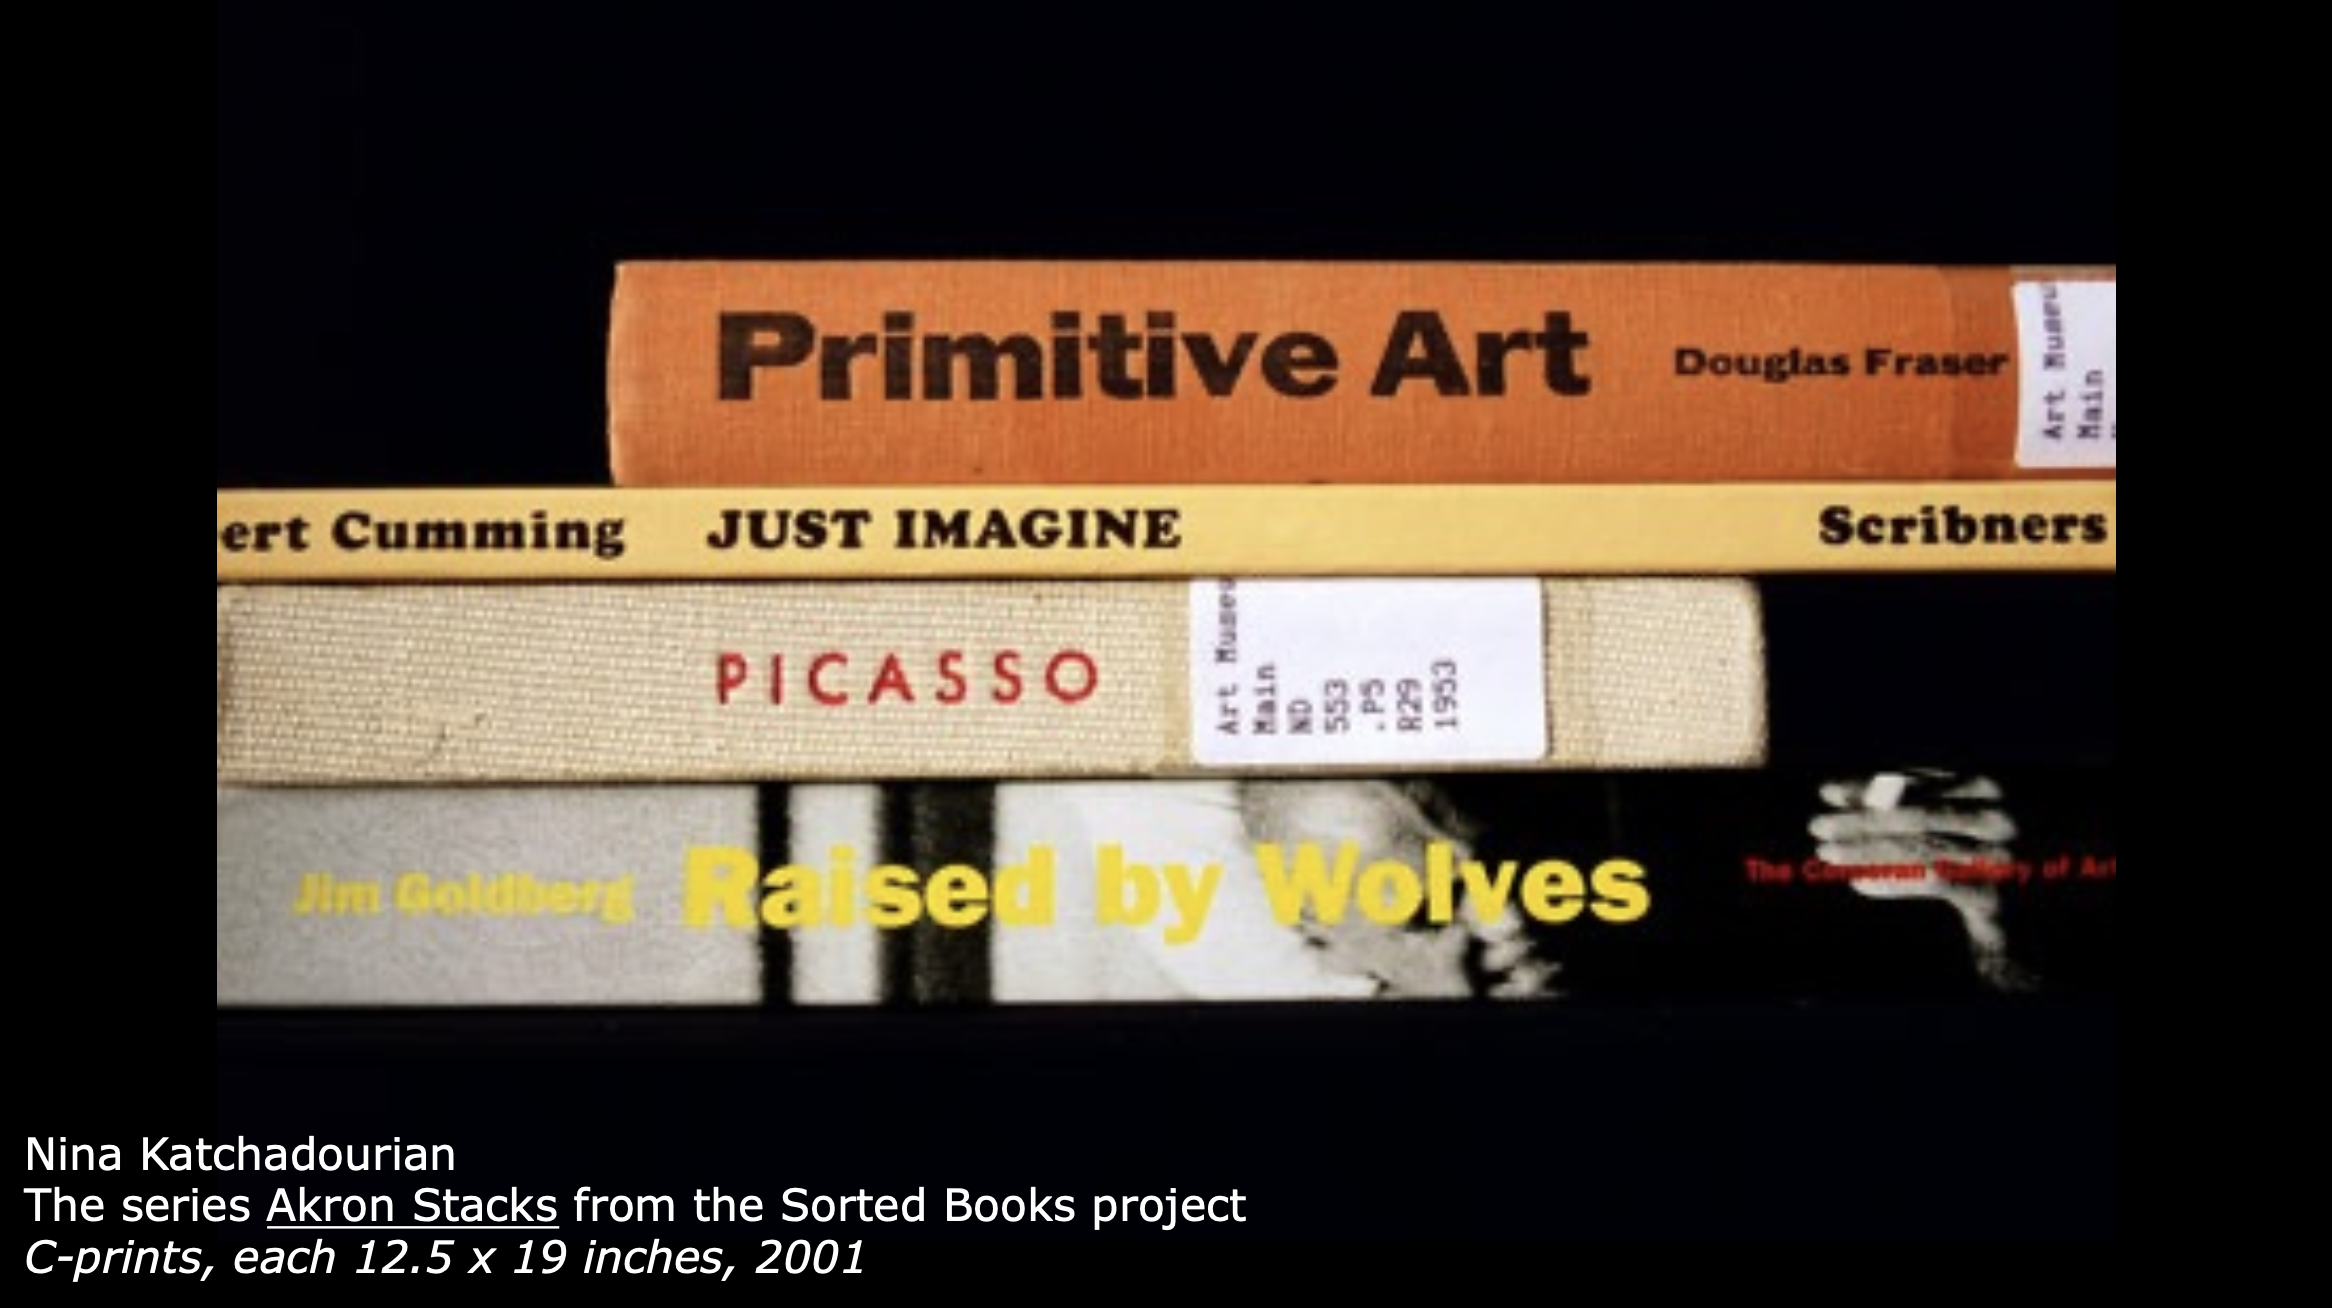 Book Spine Poetry This activity is meant to engage studio art students in the library through browsing and serendipitous discovery. Research has shown that art students have a preference for browsing as an information search strategy.
 -
 Creating Venn Diagrams in MS PowerPoint
 -
 Creating Venn Diagrams in Google Slides
 -
 Creating Flowcharts in Google Slides
 -
 Creating Flowcharts in MS PowerPoint
 -
 Creating Scatter Plots in Google Sheets
 -
 Creating Scatter Plots in MS Excel
 -
 Creating Line Graphs in Google Sheets